
Managing autoscaling in Azure Kubernetes Service (AKS) is not always straightforward. Recently, we ran into a problem where node pool scale down was not happening in both regions, and workloads were consuming resources beyond the defined cluster threshold. This article walks through the scenario, investigation, and resolution.
Contents
- 1 Scenario: Node Pool Not Scaling Down
- 1.1 The Context: A Planned Node Migration
- 1.2 The Problem: Scale-Down Stalls, Incurring Cost
- 1.3 Step 1: Investigating the Node health
- 1.4 Step 2: Describe the Each Node for cause
- 1.5 Step 3: Isolating the Node with Cordon Command
- 1.6 Step 4: Allocation adjustment or restart the effected pod
- 1.7 Conclusion
- 1.8 Other Popular Articles
Scenario: Node Pool Not Scaling Down
The Context: A Planned Node Migration
Our production AKS cluster was running a node pool named mslnxpool02 (D-series VMs) on Kubernetes version 1.31.9. Following a performance review, Microsoft recommended migrating our workloads to E-series VMs for better resource utilization and cost-efficiency aligned with our application’s profile.
- To execute this migration, our team proceeded with a blue-green approach:
- Created a new node pool with E-series VMs.
- Used identical node labels on both the old (D-series) and new (E-series) node pools.
Relied on our Deployments, which used these labels as node Selectors (from starting we having this node selectors so only applied same label to new node pool), to automatically schedule new pods onto the E-series nodes as we cordoned and drained the D-series nodes.
The strategy was to incrementally scale up the E-series pool while simultaneously scaling down the D-series pool, allowing the cluster auto scaler to seamlessly re-schedule pods and reduce node count.
The Problem: Scale-Down Stalls, Incurring Cost
The initial phase of scaling up the new node pool and migrating pods worked as expected. However, we soon noticed a critical issue: the D-series node pool failed to scale down.
Despite workloads being successfully migrated and cluster resource usage dropping significantly, several nodes in the mslnxpool02 pool remained active. Even after waiting for an extended period to account for the cluster auto scaler’s cooldown delays, the node count remained stubbornly high. This resulted in unnecessary cloud costs and a cluster full of underutilized nodes.
The question was: Why was the scale-down stuck?
The following sections detail our investigation and the root cause we uncovered.
Step 1: Investigating the Node health
In my cluster, I had a node pool mslnxpool02 with multiple nodes running Kubernetes v1.31.9. Despite low workloads, the cluster auto scaler wasn’t scaling down the pool. Checking the nodes showed that they were all in a Ready state:
#check with powershell
kubectl get nodes | findstr lnxpool02
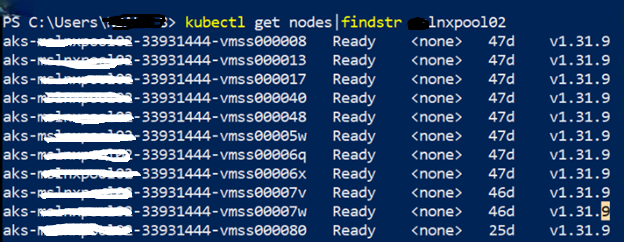
At first glance, the nodes looked healthy, but the auto scaler wasn’t freeing up any of them.
Step 2: Describe the Each Node for cause
To understand why the node couldn’t be scaled down, I began with a detailed inspection of one of the stuck nodes: aks-mslnxpool02-33931444-vmss000017.
kubectl describe node aks-lnxpool02-33931444-vmss000017
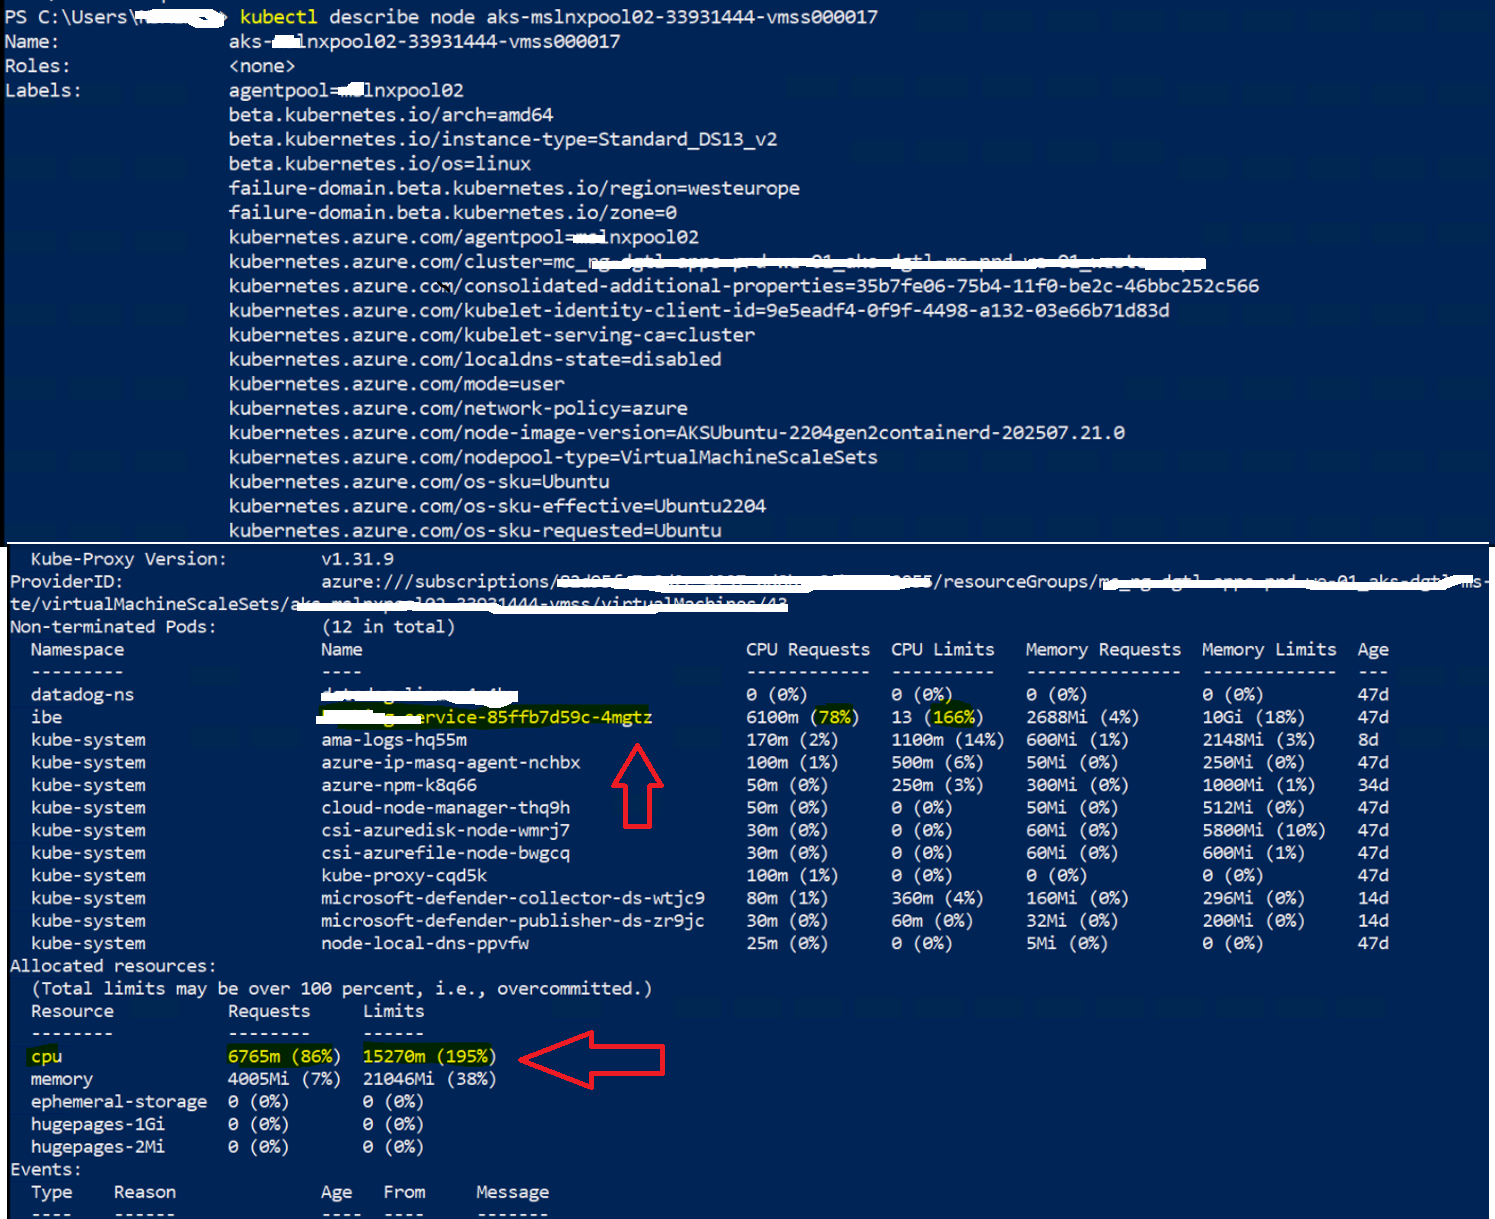
This command provides a comprehensive overview of the node’s status, capacity, and all the pods running on it. Here’s a breakdown of what I looked for and what I found:
- The node was Ready.
- Multiple workloads were running on it, including system pods (e.g., kube-proxy, csi-azure*, ama-logs, myapplication pods).
- One workload (my service) (customerfeed-service) had large CPU and memory requests as shown below:
CPU Requests: 6100m of 7820m (78%)
CPU Limits: 13 cores (166%)
Memory Requests: 2688Mi
Memory Limits: 10Gi
This explained part of the problem: auto scaler cannot evict pods that request a large percentage of node resources unless they can be rescheduled elsewhere.
Now we found the cause, the scaling down was not happened due to the high utilization of some application pods, which not allowing Node pool to scale down.
Step 3: Isolating the Node with Cordon Command
After identifying that the node was blocked from scaling down due to the customerfeed-service pod, the next step was to manually intervene and signal to the cluster that this node was a candidate for removal. This is where the kubectl cordon command comes in.
The primary goal of cordoning a node is to isolate it from receiving any new workloads. Think of it as putting up a “Do Not Enter” sign for the Kubernetes scheduler. This is a crucial, non-disruptive first step in any node maintenance or decommissioning process.
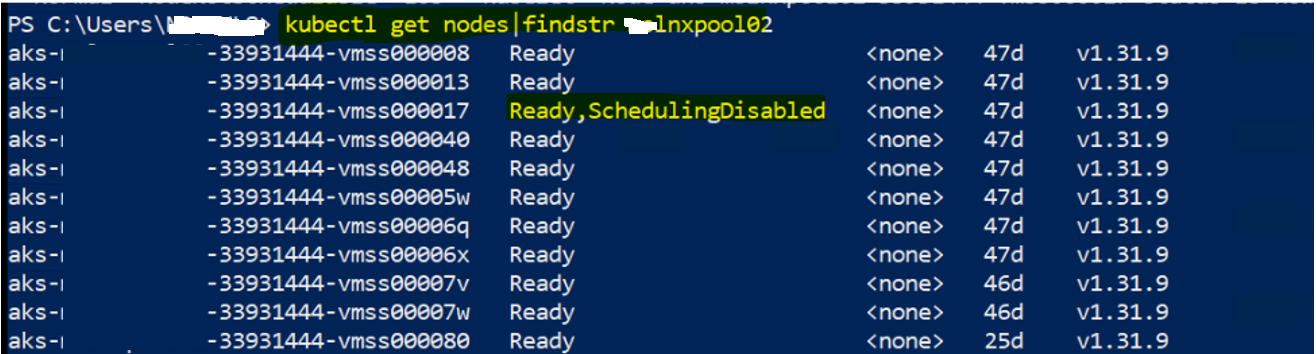
In simple , To prepare the node for scale-down, I manually cordoned it so no new pods would schedule on it:
kubectl cordon aks-mslnxpool02-33931444-vmss000017
Now the node appeared as Ready,SchedulingDisabled
kubectl get nodes | findstr mslnxpool02
aks-lnxpool02-33931444-vmss000017 Ready,SchedulingDisabled <none> 47d v1.31.9

This change told the cluster auto scaler that the node was un-schedulable.
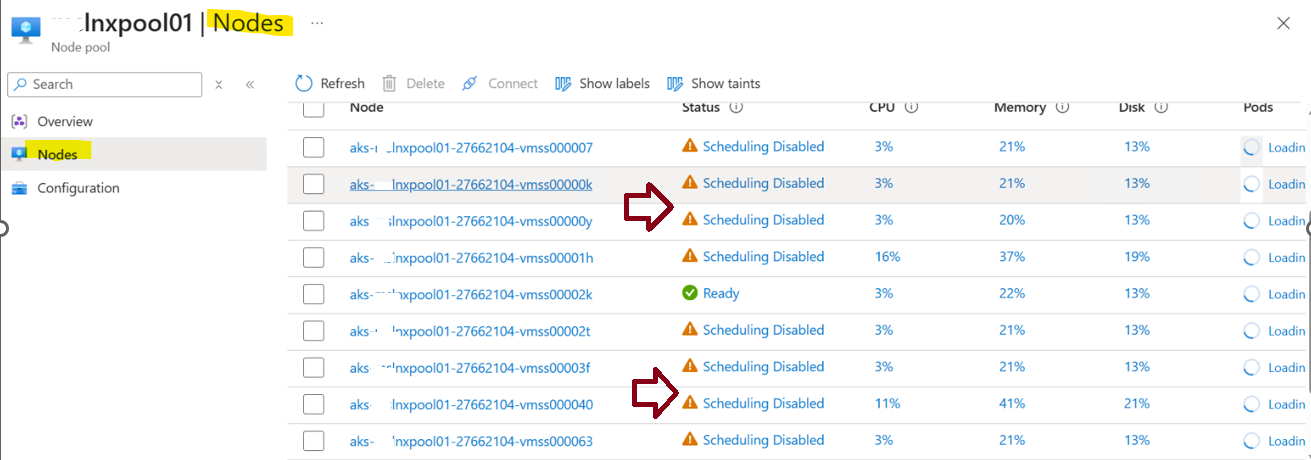
In my case, i had done cordon for all the node pool and you can confirm in the UI as well like below
Key Takeaways Highlights:
cordonis Non-Disruptive: It’s a safe first step that doesn’t affect running pods.It’s a Signal: It tells both the Kubernetes scheduler and the Cluster Autoscaler to avoid this node.
It’s Not a Solution by Itself: Cordoning prepares the node but doesn’t solve the underlying resource fragmentation problem. It’s often the prelude to a
drainoperation.
Step 4: Allocation adjustment or restart the effected pod
After cordoning the node pool, we needed to address the affected pods that were preventing the autoscaler from acting. Simply cordoning ensures no new pods are scheduled on the node, but the existing high-utilization pod continues running and blocking scale down.
To resolve this, we took two possible actions:
Option A: Restart the Affected Pod (Quick Fix)
If adjusting manifests immediately isn’t feasible (for example, in production during peak hours), a faster approach is to restart the affected pod so it can be rescheduled to a healthier node pool(as old node pool is restricted to schedule so it will map to new node pool):
1. Delete the Pod
kubectl delete pod <pod-name> -n <namespace>
2. Kubernetes Rescheduling
Kubernetes automatically recreates the pod on another available node pool.
This helps free up utilization on the cordoned pool, enabling the Cluster Auto scaler to scale it down.
⚠️ Note: This is a temporary workaround. Without fixing the resource requests in the deployment, the issue may reappear.
Option B: Allocation Adjustment (Preferred)
1. Review Pod Resource Requests and Limits
Check the resources.requests and resources.limits configuration in the deployment manifest. In our case, the application pod had very high actual CPU utilization, but its configuration did not reflect realistic usage, keeping the node pinned.
In our case, the application pod had very high CPU requests, which forced the scheduler to keep nodes active.
Example snippet:
resources:
  requests:
    cpu: "2000m"   # 2 cores requested
    memory: "4Gi"
  limits:
    cpu: "3000m"
    memory: "6Gi"
2. Adjust Resource Requests
Increase the CPU or memory requests (based on observed utilization) to match actual needs. This ensures Kubernetes schedules pods more accurately and avoids overcommitting nodes.
Example snippet:
resources:
  requests:
    cpu: "6000m"   # increased to 4 core
    memory: "4Gi"
  limits:
    cpu: "4000m"
    memory: "6Gi"
This alignment gives the auto scaler a true view of resource usage, enabling it to correctly evaluate which nodes can safely scale down.
Conclusion
Node pool scale-down issues in AKS often come down to workload placement and resource requests. In this scenario, a single oversized pod was preventing the auto scaler from acting. By analyzing node workloads, cordoning, and draining, I was able to resolve the problem and allow auto scaler to scale down efficiently.