An AKS PVC disk full condition is one of the most deceptive problems in Kubernetes operations. When a PersistentVolumeClaim (PVC) fills to 100% on Azure Kubernetes Service (AKS), the pod using it does not crash immediately — and that is what makes it so dangerous. The pod keeps showing Running in kubectl. No alert fires. Everything looks fine. Then suddenly your application starts throwing cryptic errors that seem completely unrelated to disk space.
This guide covers the fix for any workload running on AKS — whether you are running Solr, PostgreSQL, MongoDB, Elasticsearch, Redis, or any other stateful application that writes data to a PVC. The kubectl commands and the recovery steps are identical regardless of what is running inside the pod.
In our case, the workload was Sitecore with Solr on AKS. The disk-full condition showed up as this IndexWriter is closed — a misleading Lucene error that buried the real cause: java.io.IOException: No space left on device. But whether you see that error or a Postgres could not write to file, a MongoDB No space left on device, or an Elasticsearch flood stage disk watermark exceeded — the fix is exactly the same.
In this guide, you will learn how to confirm the root cause, safely expand your Solr PVC on AKS, recover the application, and rebuild the Sitecore index — all without losing any data. In my environment, Sitecore and Solr are deployed as custom Docker images running on AKS.
Prerequisites
kubectlconfigured and connected to your AKS cluster.- Permissions to manage PVCs, StatefulSets, Deployments, and pods in your Kubernetes namespace.
- Solr deployed on AKS using the Azure
managed-premiumstorage class. - Access to the Sitecore Control Panel for index management (for the Sitecore-specific recovery step).
Which Workloads Does This Affect?
Any stateful pod that writes data to a PVC can hit this problem. The AKS PVC disk full fix is identical for all of them. What changes is only the application-level error message and the final recovery step. Here are the most common workloads and the errors each one throws when disk space runs out:
- Solr / Elasticsearch:
java.io.IOException: No space left on device→this IndexWriter is closed - PostgreSQL:
could not write to file base/pgsql_tmp: No space left on device - MongoDB:
No space left on device: couldn't open file for writing - MySQL / MariaDB:
ERROR 3 (HY000): Error writing file '/tmp/...' (Errcode: 28 - No space left on device) - Redis:
MISCONF Redis is configured to save RDB snapshots, but it's currently unable to persist on disk - Any custom application pod: write failures, silent data loss, or application-level errors that bury the real
No space left on devicecause deep in the logs.
💡 The kubectl fix is identical for all workloads — expand the PVC, restart the pod, verify recovery. Only the final application-level recovery step differs per workload.
Why the Error Message Is Always Misleading
The most important thing to understand before you touch anything is this: the top-level error your application throws is almost never the real cause. It is a downstream symptom. Always scroll to the very bottom of the stack trace to find the true root cause.
For Sitecore with Solr, the index rebuild job logs show something like this:
Job started: Index_Update_IndexName=sitecore_jss_web_index
#Exception: System.Reflection.TargetInvocationException
---> SolrNet.Exceptions.SolrConnectionException:
  this IndexWriter is closed
Caused by: org.apache.lucene.store.AlreadyClosedException: this IndexWriter is closed
Caused by: java.io.IOException: No space left on device
Here is the exact chain of events that causes this error. First, the Solr PVC fills to 100% capacity. Next, Lucene tries to merge index segments during the rebuild — a process that requires significant temporary extra disk space. Because no space is available, the write fails. As a result, the IndexWriter closes itself as a safety measure to protect data integrity. After that, Sitecore detects the closed IndexWriter and throws the AlreadyClosedException. Finally, the rebuild job fails — and keeps failing on every retry until the underlying disk problem is resolved.
⚠️ Until you fix the AKS PVC disk full condition, every single index rebuild will fail with the same error — no matter how many times you retry it from Sitecore.
Step-by-Step: AKS PVC Disk Full Fix
Step 1: Confirm the AKS PVC Disk Is Full
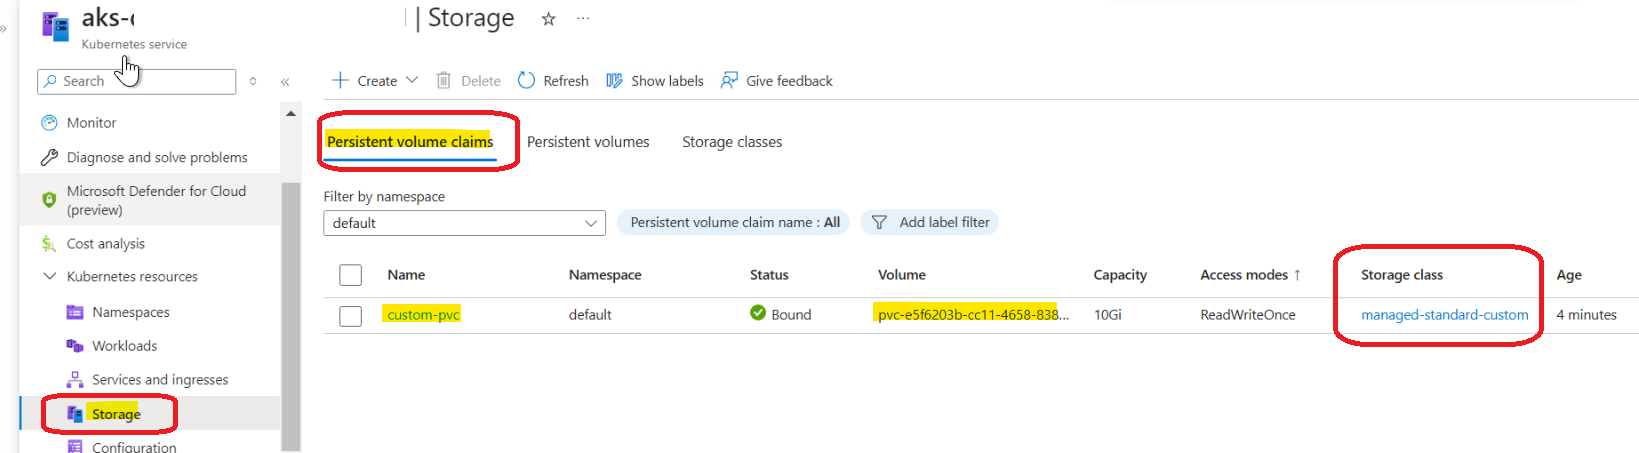
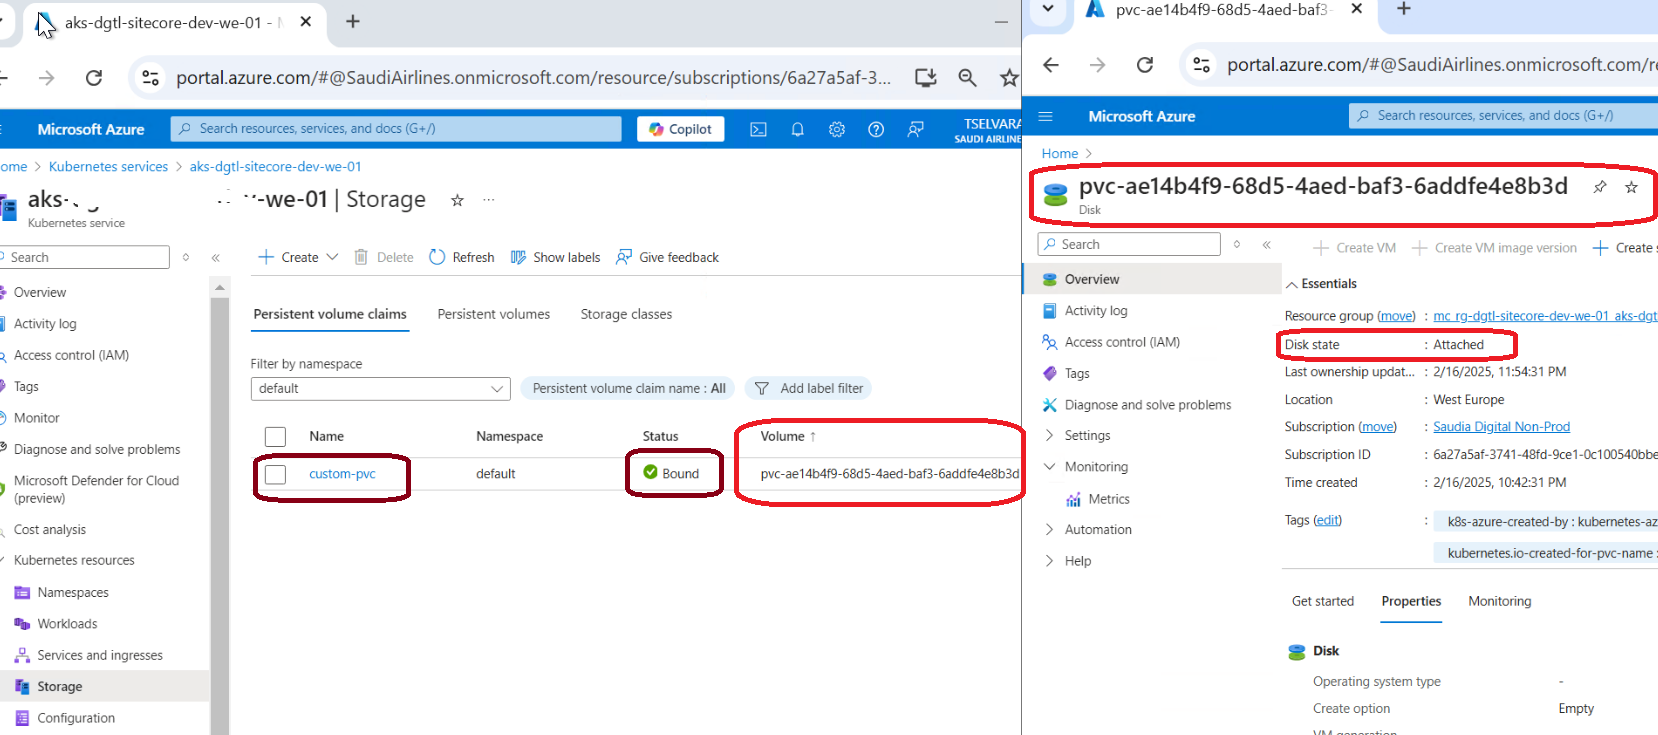
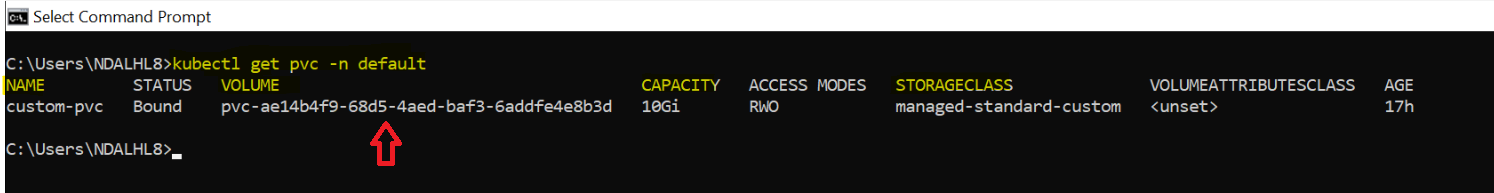
Before making any changes, confirm that disk exhaustion is actually the root cause. First, check your PersistentVolumeClaims in the relevant namespace:
kubectl get pvc -n solr
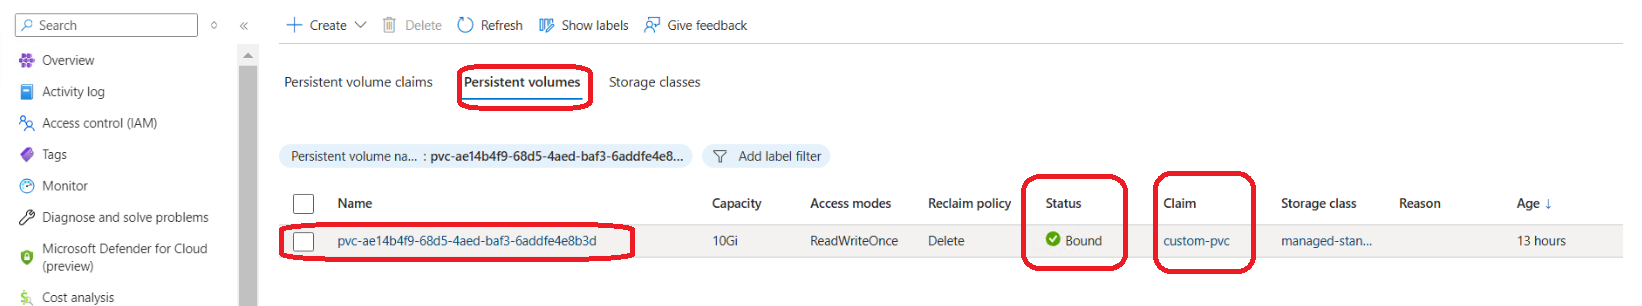
The output will show all PVCs in a Bound status — which looks completely healthy. However, Bound only means the PVC is attached to the pod. It tells you nothing about how much space is actually used inside it:
NAME              NAMESPACE  STATUS  CAPACITY  STORAGECLASS
solr-leader-disk  solr       Bound   10Gi      managed-premium
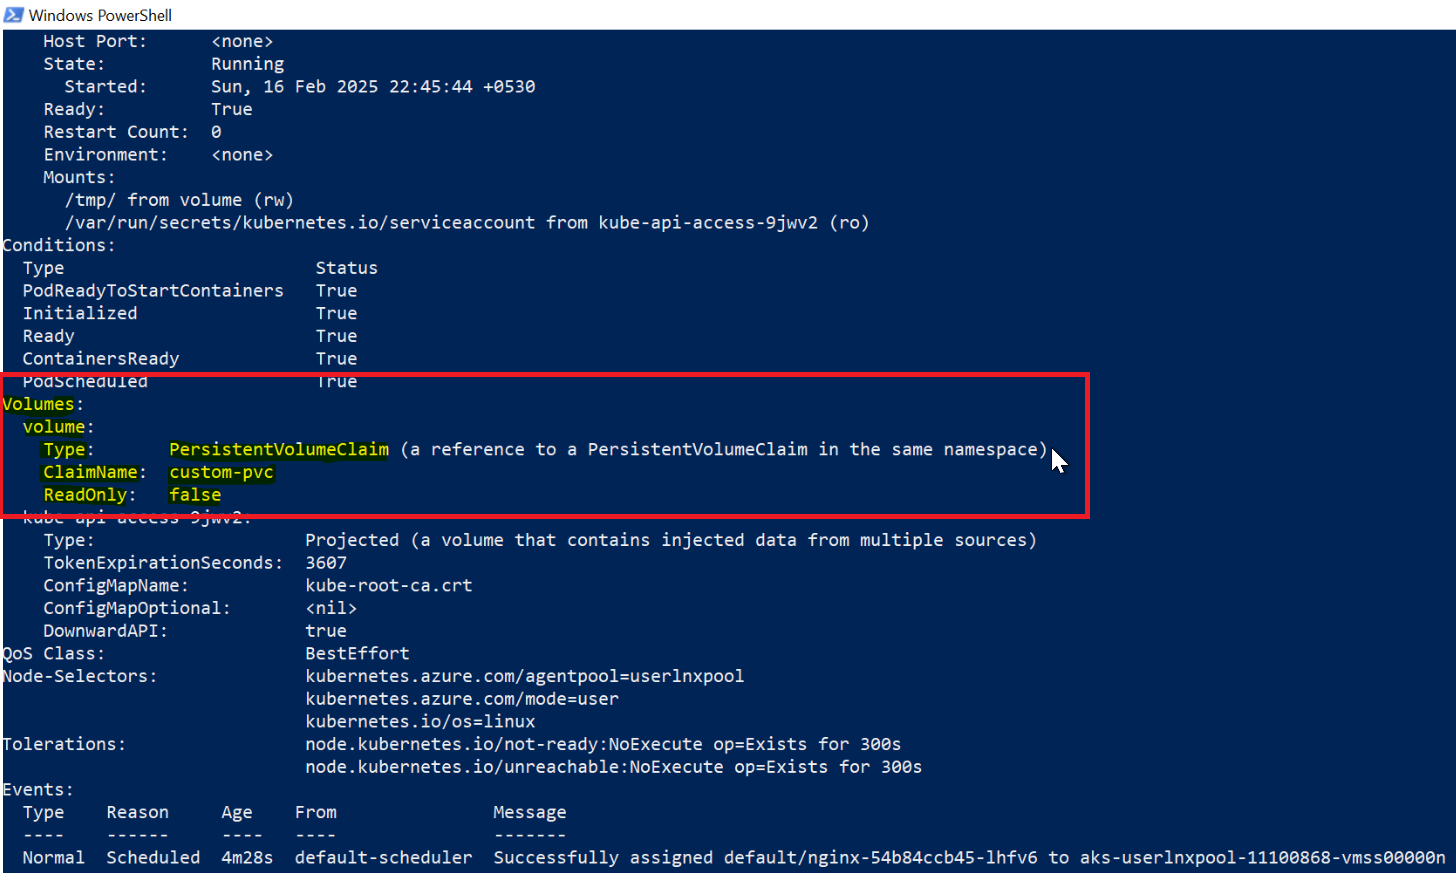
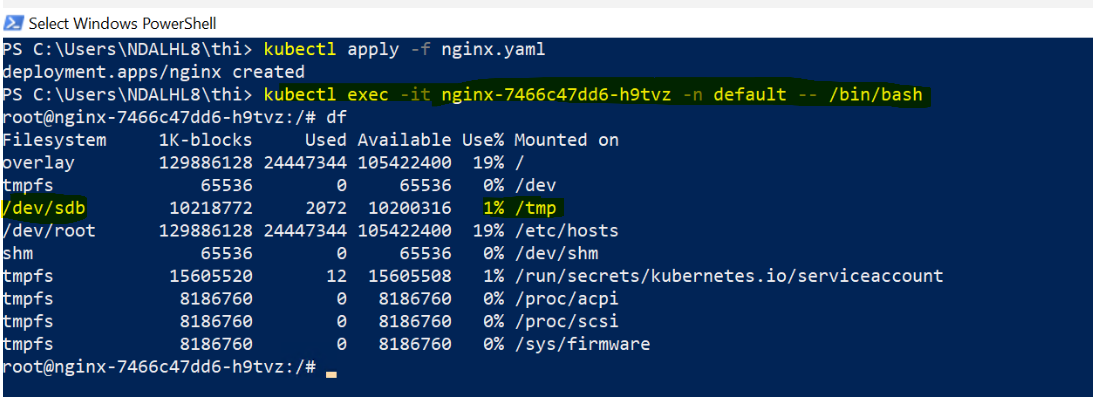
Next, exec directly into the pod to check actual disk usage:
kubectl exec -it <solr-pod-name> -n solr -- df -h
Look for the mount point where your application stores data — typically /var/solr for Solr, /var/lib/postgresql for Postgres, or /data/db for MongoDB. If you see Use% at 100%, you have confirmed the root cause. Furthermore, grep the pod logs directly for the IOException to be certain:
kubectl logs <solr-pod-name> -n solr | grep -i "no space"
Step 2: AKS PVC Disk Full Fix — Expand the PVC Online
Azure’s managed-premium storage class supports online volume expansion by default. Consequently, you can grow the PVC without stopping the pod, without losing data, and without any application downtime. Note that you can only ever expand a PVC — Kubernetes does not support shrinking.
You have two methods to expand. Choose whichever fits your workflow:
Method 1: kubectl patch (faster — one command)
kubectl patch pvc solr-leader-disk-2023081617 -n solr \
  -p '{"spec":{"resources":{"requests":{"storage":"20Gi"}}}}'
Method 2: kubectl edit (visual — easier to verify)
kubectl edit pvc solr-leader-disk-2023081617 -n solr
In the editor, find the spec.resources.requests.storage field and change it from 10Gi to 20Gi:
spec:
resources:
requests:
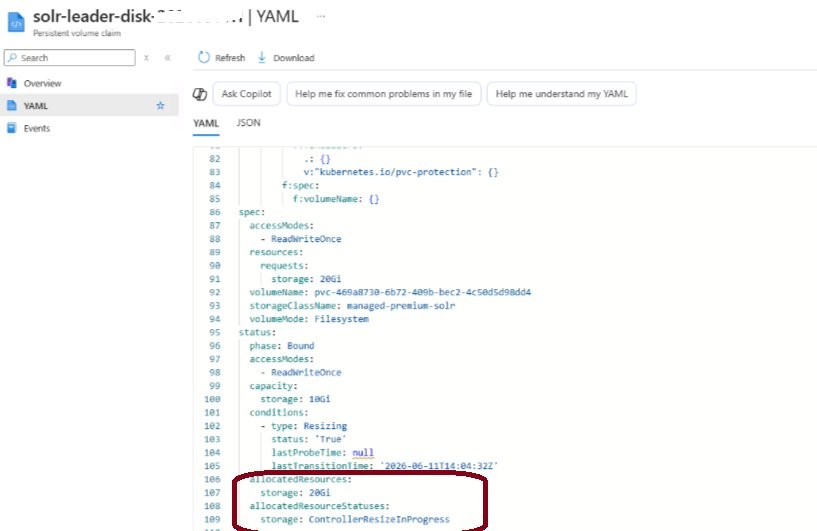
storage: 20Gi # changed from 10GiAfter saving, watch the PVC status in real time. You will briefly see FileSystemResizePending — that is completely normal. Wait for it to return to Bound:
kubectl get pvc -n solr -w
The resize typically takes 5–10 minutes on Azure. The pod keeps running and all data remains accessible throughout the entire process.
💡 Pro tip: During a Solr index rebuild, Lucene needs up to 3× the current index size as temporary working space. If your current index is 8Gi, plan for at least 30Gi total — not just 20Gi. The same rule applies to Elasticsearch index merges and PostgreSQL VACUUM operations.
Step 3: Restart the Pod to Complete Recovery
This is the step most guides skip — and it is the one that trips people up most often. Even after the AKS PVC disk is expanded, the application process inside the pod is still in a broken state from the original crash. Simply having more disk space does not automatically fix this. You must restart the pod so the application remounts the expanded volume cleanly and resets its internal error state.
For Solr running as a StatefulSet (the most common AKS setup):
kubectl rollout restart statefulset/solr -n solr
Alternatively, if your workload runs as a Deployment:
kubectl rollout restart deployment/solr -n solr
For other workloads, simply replace solr with your StatefulSet or Deployment name and adjust the namespace accordingly. The restart causes a brief interruption of around 1–2 minutes. As a result of the restart, three things happen automatically — the broken application state is cleared, the expanded volume is remounted with the full new capacity, and the application performs its own internal recovery on startup.
Step 4: Verify the Pod and Disk Are Healthy
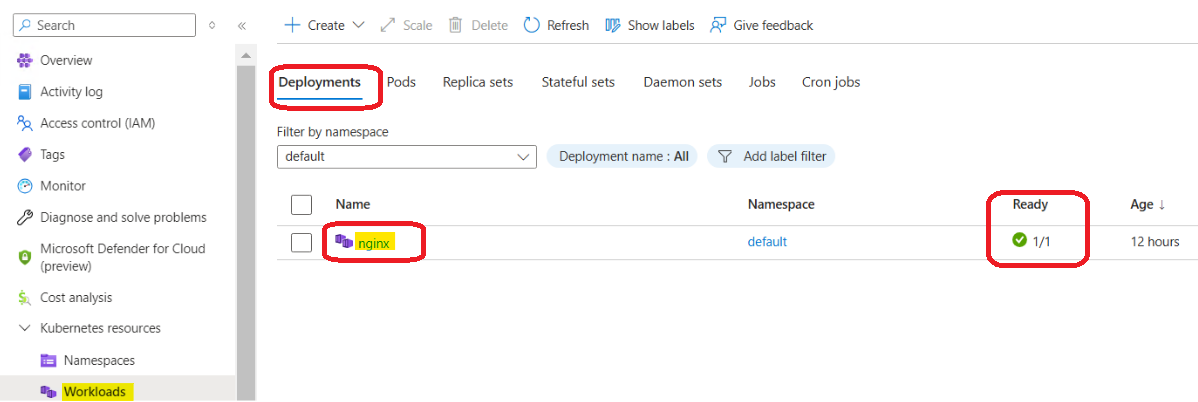
Before touching the application layer, confirm the pod is fully healthy at the infrastructure level. First, check that all pods are back in a Running state:
kubectl get pods -n solr
Next, check the pod logs for clean startup output with no errors:
kubectl logs <solr-pod-name> -n solr --tail=50
In addition, confirm the new disk size is visible and showing healthy usage inside the pod:
kubectl exec -it <solr-pod-name> -n solr -- df -h
The mount point should now show 20Gi total with plenty of free space. If it still shows 10Gi, the filesystem resize has not completed yet — wait a few more minutes and check again. If it still has not updated after 15 minutes, the pod restart itself will trigger the filesystem resize on remount.
Step 5: Application-Level Recovery (Per Workload)
Once the pod is healthy at the infrastructure level, perform the application-specific recovery step for your workload. Furthermore, this step varies depending on what was running in the pod:
- Sitecore + Solr: Log in to Sitecore → Control Panel → Indexing Manager → select
sitecore_jss_web_index→ click Rebuild. The job should now complete successfully with noIndexWritererrors. - Elasticsearch: Check cluster health with
GET /_cluster/health. If any indices are red or yellow, trigger a manual shard allocation using the Cluster Reroute API. - PostgreSQL: Run
VACUUM ANALYZEon affected tables to clean up any incomplete transactions. Check for replication lag if running a replica set. - MongoDB: Check replica set status with
rs.status(). Rundb.repairDatabase()if any collections show corruption flags. - Redis: Verify persistence is working again with
INFO persistence— confirmrdb_last_bgsave_status: ok. - Custom app pod: Trigger whatever write operation was failing before the disk was full. Check the application logs to confirm the error is gone.
How to Prevent AKS PVC Disk Full in the Future
The most frustrating thing about this problem is that it is completely preventable. Here is what we put in place after this incident — and what I recommend for every production AKS deployment running stateful workloads:
- Set Azure Monitor alerts at 80% PVC usage. By the time you hit 100% it is already too late. An alert at 80% gives you comfortable time to expand before anything breaks. In Azure Portal, go to Monitor → Alerts and create a metric alert on
Persistent Volume Used Bytes. - Use Prometheus and Grafana on AKS. The
kubelet_volume_stats_used_bytesmetric gives you real-time disk usage per PVC across every namespace. Pair it with a Grafana dashboard and a Slack alert — you will never be caught off guard again. - Start bigger for production. A 10Gi PVC is fine for development. In production, start at 50Gi or more for any write-heavy workload like Solr, Elasticsearch, or PostgreSQL. Storage is cheap — downtime is not.
- Plan for 3× headroom during operations. Lucene index rebuilds, PostgreSQL VACUUM, and MongoDB compaction all need temporary space that can be 2–3× the current data size. Always leave enough headroom before triggering these operations.
- Schedule regular maintenance operations. For Solr, run periodic
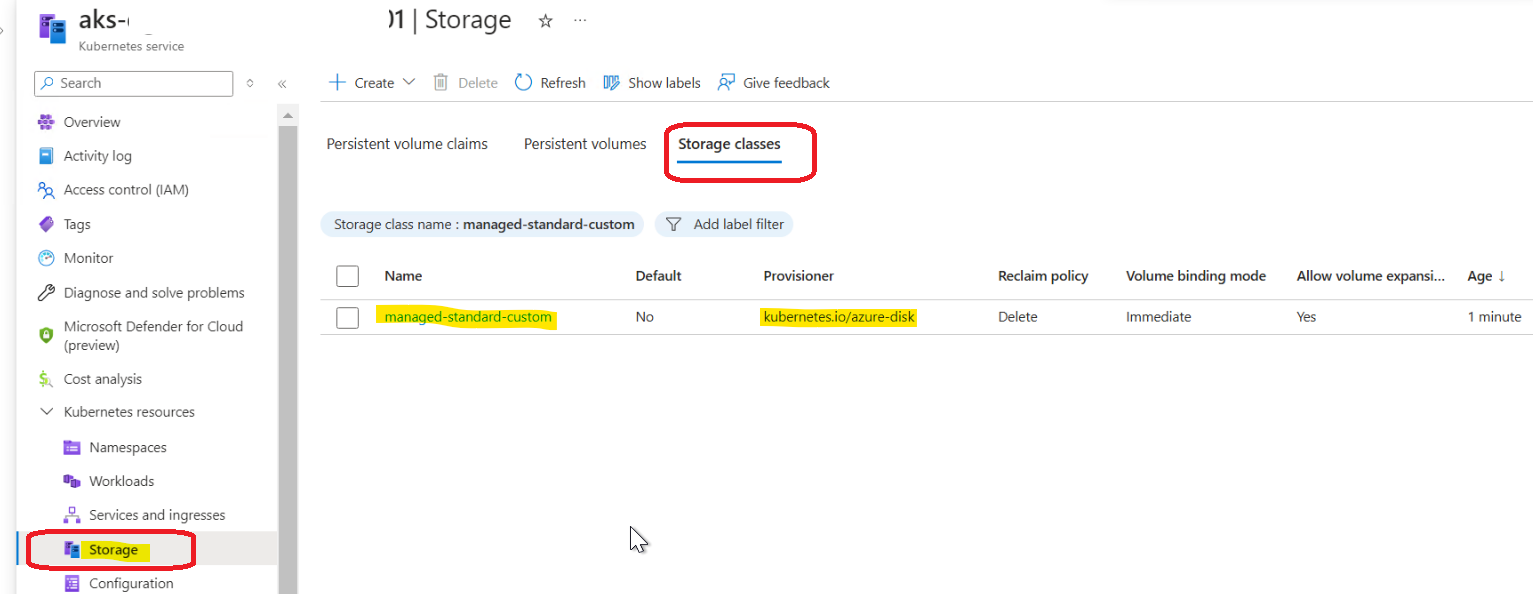
OPTIMIZEcommands to merge segments and reduce disk footprint. For Postgres, schedule regularVACUUM. These can reduce disk usage by 20–40% over time. - Verify allowVolumeExpansion on your storage class. Run
kubectl describe storageclass managed-premiumand confirmAllowVolumeExpansion: trueis set. Azuremanaged-premiumandmanaged-csi-premiumboth support it by default — but custom storage classes may not.
Conclusion : AKS PVC Disk Full Fix in Under 15 Minutes
An AKS PVC disk full condition is one of the most deceptive problems in Kubernetes operations. The pod stays Running, no obvious alert fires, and the error your application throws is almost never the one that points to disk space. In our case it was this IndexWriter is closed for Sitecore Solr — but it could just as easily be a Postgres write failure, a MongoDB corruption error, or a Redis persistence warning.
In summary, the fix is always the same three steps — confirm the disk is full with df -h inside the pod, expand the PVC online using kubectl patch or edit, and restart the pod to clear the broken application state. Furthermore, the entire process takes under 15 minutes and preserves all your data completely. Most importantly, it is 100% preventable with the right Azure Monitor alerts in place before the next incident hits.
Quick Reference: Commands for AKS PVC Disk Full Fix
- Check PVCs:
kubectl get pvc -n <namespace> - Check disk inside pod:
kubectl exec -it <pod> -n <namespace> -- df -h - Grep for disk error:
kubectl logs <pod> -n <namespace> | grep -i "no space" - Expand PVC:
kubectl patch pvc <name> -n <namespace> -p '{"spec":{"resources":{"requests":{"storage":"20Gi"}}}}' - Watch resize:
kubectl get pvc -n <namespace> -w - Restart StatefulSet:
kubectl rollout restart statefulset/<name> -n <namespace> - Restart Deployment:
kubectl rollout restart deployment/<name> -n <namespace> - Verify pod health:
kubectl get pods -n <namespace>
Frequently Asked Questions
Q: Will expanding the PVC delete my data?
No. PVC expansion on AKS is completely non-destructive. Azure grows the underlying managed disk and extends the filesystem. Your data — whether it is Solr index segments, Postgres tables, or MongoDB collections — is fully preserved throughout.
Q: Does the application go down during PVC expansion?
No. The disk expansion itself causes zero downtime. The only brief interruption — around 1–2 minutes — happens when you restart the pod in Step 3. The application itself stays up during the disk resize.
Q: Can I shrink the PVC back after fixing the issue?
No. Kubernetes does not support PVC shrinking. Once expanded, the size is permanent. Plan your initial PVC sizes carefully — especially for production write-heavy workloads.
Q: The df -h still shows the old size after PVC expansion. Why?
The Kubernetes PVC resize and the filesystem resize inside the pod are two separate operations. If the filesystem has not caught up, wait a few more minutes and recheck. If it still shows the old size after 15 minutes, the pod restart in Step 3 will trigger the filesystem resize on the next mount.
Q: My storage class does not support volume expansion. What do I do?
Run kubectl describe storageclass <name> and check for AllowVolumeExpansion: true. If it is not set, you will need to provision a new larger PVC and migrate the data manually using a tool like kubectl cp or a pod-to-pod rsync job.
Q: I have multiple Solr leader and follower PVCs. Do I need to expand all of them?
Yes. Expand every PVC that is full. If only the leader PVC is full, start there — but check the follower PVCs too, as they often fill at a similar rate.