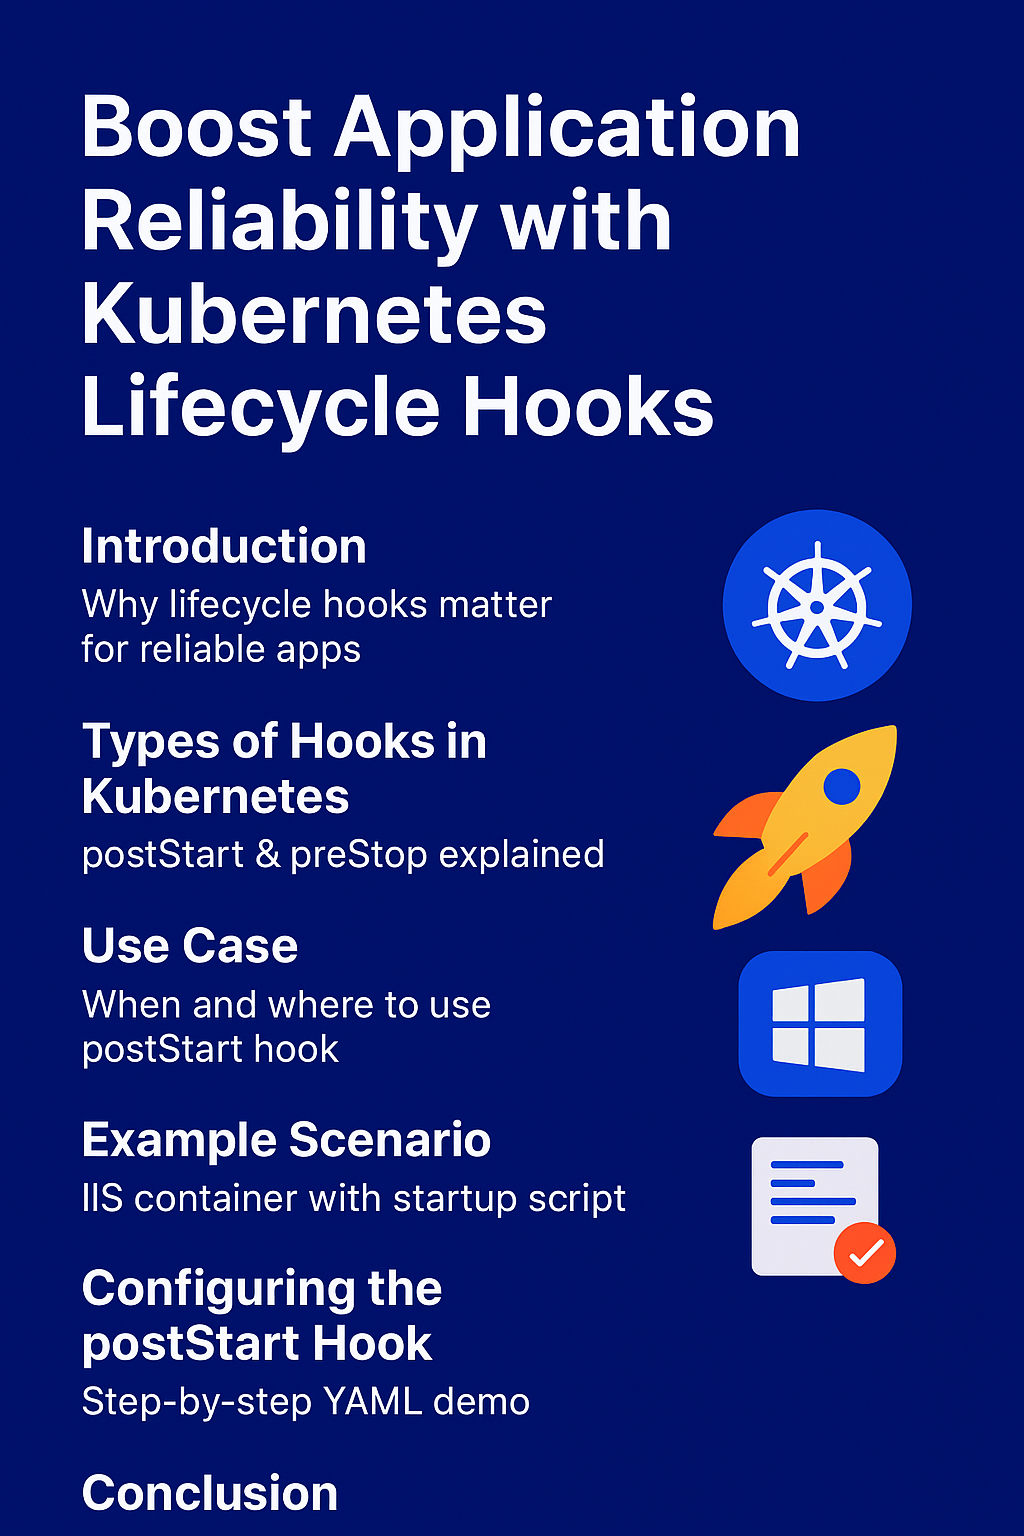
Introduction
Hooks allow developers to run custom logic at critical points in a container’s lifecycle. These hooks help with initialization and graceful shutdown, ensuring applications are reliable, performant, and consistent. In this article, we’ll explore lifecycle hooks in Kubernetes, with a focus on the postStart hook, real-world use cases, and practical examples using Windows IIS containers.
Types of Hooks in Kubernetes
Kubernetes offers two primary lifecycle hooks for containers:
postStart Hook:
Triggered immediately after a container is started.
Commonly used for initializing services, setting up configurations, or performing other preparatory tasks before the application is fully operational. PostStart Hook provides us ability to perform some task before the pod is completely initialized. This hook is executed immediately after a container is created. However, there is no guarantee that the hook will execute before the container ENTRYPOINT command. This is useful for scenarios where you want to perform some setup before the main container in the pod starts running.
preStop Hook:
Triggered just before a container is terminated.
Often used to gracefully shut down services, close connections, or clean up resources to ensure data integrity and prevent resource leaks. This is particularly useful for applications that need to gracefully shut down, ensuring that ongoing processes complete before the container stops. Examples of tasks include closing database connections, finalizing transactions, or notifying external systems about impending shutdown.
In this post, we are going to discuss more deep in to the postStart Hook
Use Case : When and Where is the postStart Hook Required?
The postStart lifecycle hook is useful in scenarios where specific tasks need to be performed before the main application in a container becomes functional. Some common use cases include:
Environment Setup: Copying necessary files or templates. Modifying configuration files dynamically based on the environment.
Application Warm-up: Performing application-specific warm-up tasks to reduce the latency of initial requests.
Service Initialization: Setting up dependencies or configurations required by the application. Starting background services or processes necessary for the container’s operation.
Example Scenario
Consider a scenario where an ASP.NET application hosted on IIS requires a startup script (startup.ps1) to configure IIS settings, initialize application-specific environment configuration substitution, or perform other preparatory tasks. Using the postStart hook ensures that these configurations are executed as soon as the container starts.
Configuring the postStart Lifecycle Hook
Here’s an example Kubernetes pod specification that uses the postStart lifecycle hook to execute a PowerShell script: In the provided example, the postStart hook logs a message to C:\poststart.log in a Windows IIS container, confirming successful initialization. By leveraging postStart hooks, you can add flexibility and control to your containerized applications, ensuring they are fully prepared to handle their workloads upon startup.
For this example, i had explain with simple logging the message in the poststart. Based on requirement, you can have .ps1 (startup.ps1)/configuration file to execute during the container creation.
Example 1: Create Simple log file in PostStart
STEP 1: Create the pod using below YAML
Save the below YAML as iis-pod and run the below kubectl cmd to create the pods in AKS, as shown in the STEP 2
kind: Pod
metadata:
name: iis-pod
spec:
containers:
- name: iis-container
image: mcr.microsoft.com/windows/servercore/iis:windowsservercore-ltsc2022
lifecycle:
postStart:
exec:
command:
- cmd
- /c
- echo PostStart hook executed > C:\poststart.log
ports:
- containerPort: 80
#Execute the YAML to create the pod
kubectl create -f iis-pod.yaml
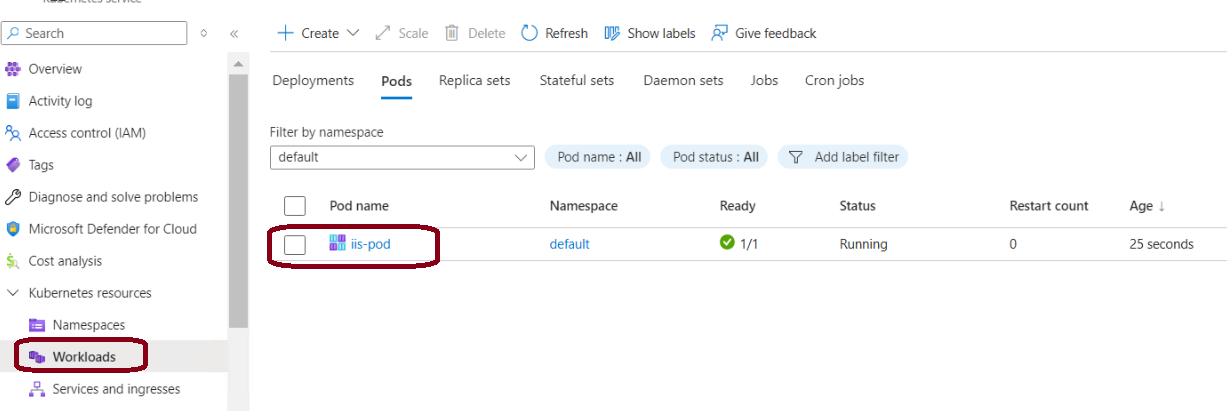
STEP 2: Check the pod status
Execute the below Kubectl comments to ensure pod is running successfully.
# Command to get pods’ status:
kubectl get pods
# Command to view the details of Pod:
kubectl describe pod iis-pod
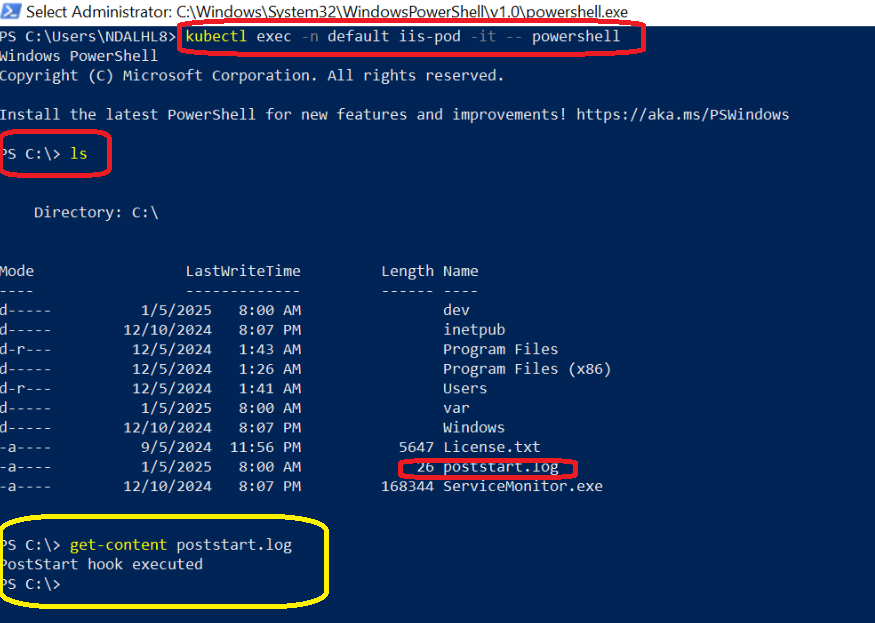
STEP 3: Get in to the pod to verify poststart.log file
The postStart hook executes the specified command and the text “PostStart hook executed” is written to the file C:\poststart.log. The container initializes and becomes ready to handle requests on port 80
Explanation of the Configuration (Command Breakdown)
- The exec : field specifies the command to be executed:
- cmd: Specifies the Windows Command Prompt as the executor.
- /c: Tells the Command Prompt to execute the provided command and then terminate.
- echo PostStart hook executed > C:\poststart.log: Writes the text “PostStart hook executed” into the file C:\poststart.log. If the file does not exist, it is created automatically. If it exists, the content is overwritten.
- Port 80 : The container exposes port
80, which is the default HTTP port for IIS.
# Enter in to the pod using Kubectl
kubectl exec -n default iis-pod -it -- powershell
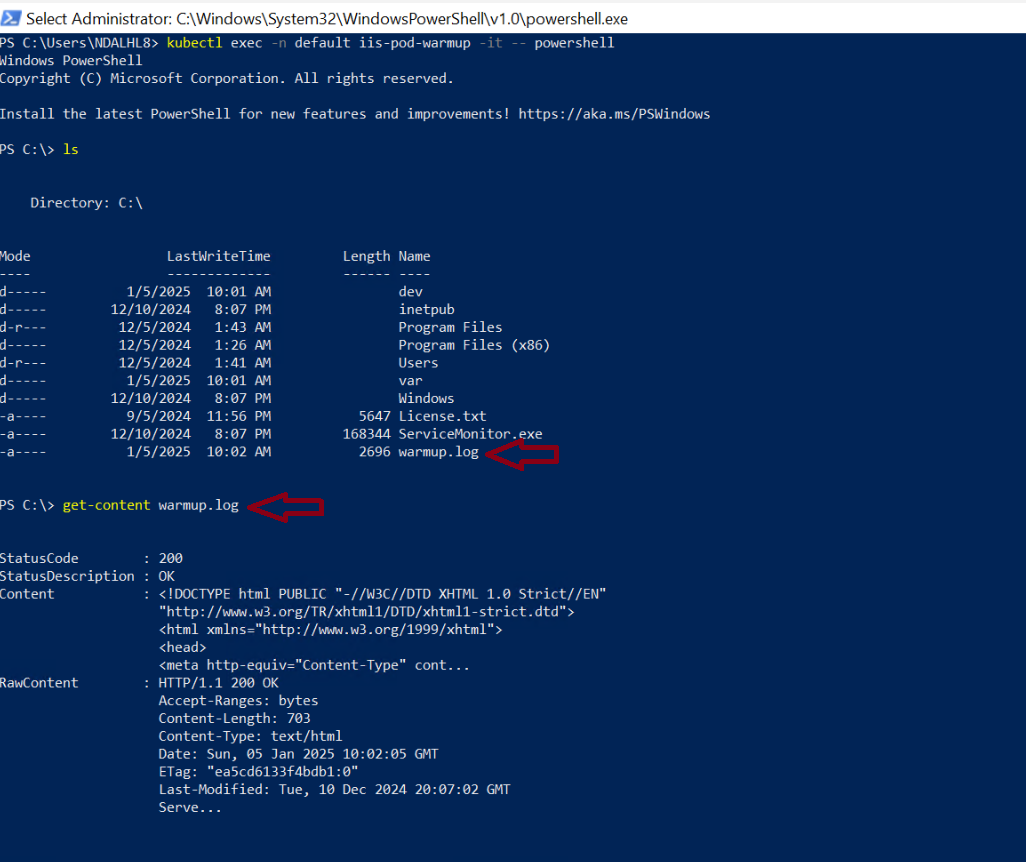
Example 2: Create Warmup in PostStart
The postStart hook waits 5 seconds for IIS to initialize. It sends an HTTP GET request to http://localhost to ensure the default page is accessible and finally the HTTP response is saved to C:\warmup.log, which can be inspected for debugging or verification.
Explanation of the Configuration (Command Breakdown)
- Start-Sleep -Seconds 5; : Introduces a short delay to ensure IIS has started before making a request.
- Invoke-WebRequest -Uri http://localhost: Sends an HTTP request to the IIS default page hosted on the same container.
- Out-File -FilePath C:\warmup.log -Force; : Saves the HTTP response to the file C:\warmup.log. The -Force option ensures the file is created or overwritten if it exists.
- Error Handling: A try block handles successful execution, and the catch block logs errors if the warm-up process fails.
- Ports 80: The container exposes port 80, which is used by IIS to serve the application.
apiVersion: v1
kind: Pod
metadata:
name: iis-pod-warmup
spec:
containers:
- name: iis-container
image: mcr.microsoft.com/windows/servercore/iis:windowsservercore-ltsc2022
lifecycle:
postStart:
exec:
command:
- powershell
- '-Command'
- >
try {
Start-Sleep -Seconds 5; # Wait for IIS to start
Invoke-WebRequest -Uri http://localhost -UseBasicParsing | Out-File -FilePath C:\warmup.log -Force;
Write-Host "Warm-up request completed successfully.";
} catch {
Write-Error "Warm-up request failed: $_";
}
ports:
- containerPort: 80
Output
Conclusion
Kubernetes lifecycle hooks like postStart give developers greater control over container startup behavior. Whether you’re initializing services, warming up applications, or preparing IIS environments, hooks can significantly improve reliability and user experience.