However, the teams that manage these clusters need to know what’s happening to the state of objects in the cluster, and this in turn introduces a requirement to gather real-time information about cluster statuses and changes. This is enabled by Kubernetes events, which give you a detailed view of the cluster and allow for effective alerting and monitoring.
In this guide, you’ll learn how Kubernetes events work, what generates them, and where they’re stored. You’ll also learn to integrate Grafana with your Kubernetes environment to effectively use the information supplied by those events to support your observability strategy.
Contents
What are Kubernetes events?
Kubernetes events provide a rich source of information. These objects can be used to monitor your application and cluster state, respond to failures, and perform diagnostics. The events are generated when the cluster’s resources — such as pods, deployments, or nodes — change state.
Whenever something happens inside your cluster, it produces an events object that provides visibility into your cluster. However, Kubernetes events don’t persist throughout your cluster life cycle, as there’s no mechanism for retention. They’re short-lived, only available for one hour after the event is generated.
Some of the reason for events generation:
- Kubernetes events are automatically generated when certain actions are taken on objects in a cluster, e.g., when a pod is created, a corresponding event is created. Other examples are changes in pod status to pending, successful, or failed. This includes reasons such as pod eviction or cluster failure.
- Events are also generated when there’s a configuration change. Configuration changes for nodes can include scaling horizontally by adding replicas, or scaling vertically by upgrading memory, disk input/output capacity, or your processor cores.
- Scheduling or failed scheduling scenarios also generate events. Failures can occur due to invalid container image repository access, insufficient resources, or if the container fails a liveness or readiness probe.
Why Kubernetes Events are Useful
Kubernetes events are a key diagnostic tool because they:
- Help detect issues with deployments, services, and pods.
- Provide insights into scheduling failures, container crashes, and resource limits.
- Track changes and status updates of various objects.
- Assist in debugging networking and storage issues.
- Support performance monitoring by identifying anomalies.
Types of Kubernetes Events
Kubernetes Events can broadly be categorized into two types:
Normal Events: These events signify expected and routine operations in the cluster, like a Pod being scheduled or an image being successfully pulled.
Warning Events: Warning events indicate issues that users need to address. These might include failed Pod scheduling, errors pulling an image, or problems with resource limits.
How to Collect Kubernetes Events
Kubectl is a powerful Kubernetes utility that helps you manage your Kubernetes objects and resources. The simplest way to view your event objects is to use kubectl get events.
When working with Kubernetes Events, the volume of data can be overwhelming, especially in large clusters. Efficiently filtering and sorting these events is key to extracting meaningful insights. Here are some practical tips to help you manage this:
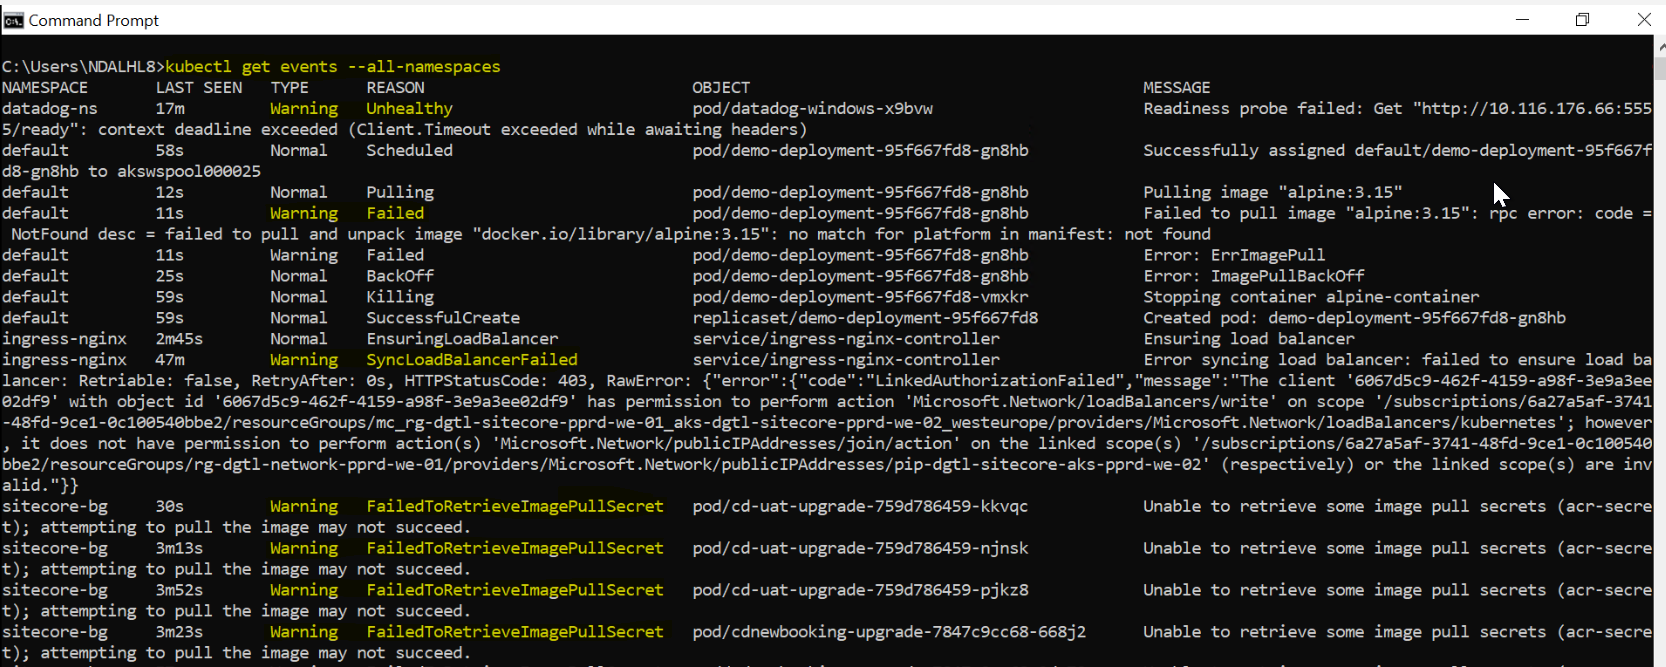
To view all Kubernetes events in a cluster:
Add the -A flag to see events from all namespaces.
1 2 3 4 5 | kubectl get events --all-namespaces kubectl get events -A |
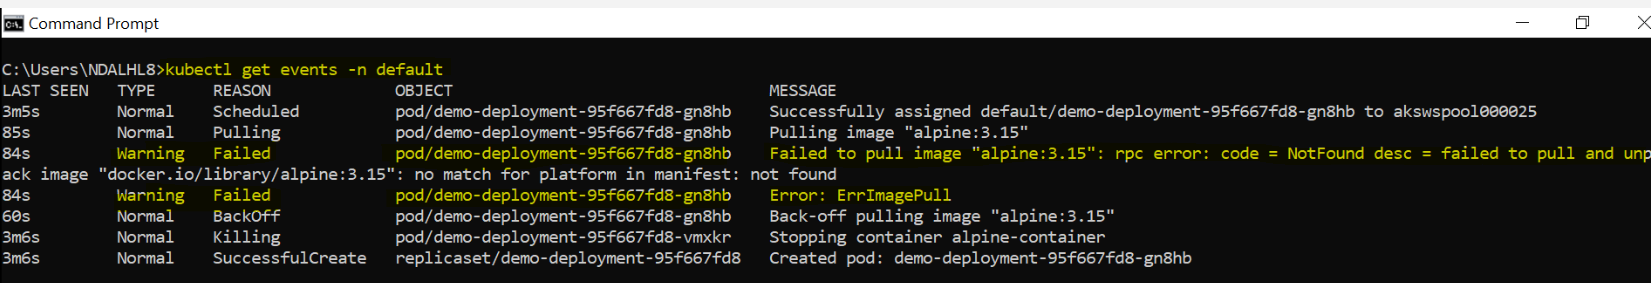
To view events for a specific namespace:
Replace <NAMESPACE_NAME> with the actual namespace. This command filters events to show only those occurring in a specified namespace.
1 2 3 | kubectl get events -n <namespace> |
Get a detailed view of events
Add the -o wide flag to get a comprehensive view of each event, including additional details not visible in the standard output.
1 2 3 | kubectl get events -o wide |
Stream live events
Add the -w command to stream events in real-time. This is particularly useful for monitoring ongoing activities or troubleshooting live issues, as it updates continuously as new events occur. Use Ctrl+C to terminate the stream.
1 2 3 | kubectl get events -w |
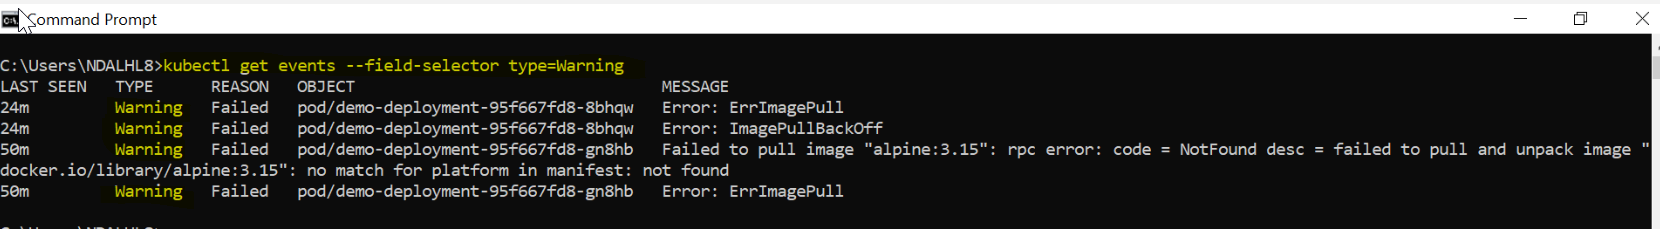
Use field selectors for precise filtering
Add the –field-selector flag to filter events based on specific field values. Replace with the event type you want to filter by. For example, kubectl get events –field-selector type=Warning will only show events of type Warning. This is particularly useful for isolating events related to errors or critical issues.
1 2 3 4 5 6 | kubectl get events --field-selector type=<EVENT_TYPE> #command will return all events of type Warning in the current namespace. kubectl get events --field-selector type=Warning |
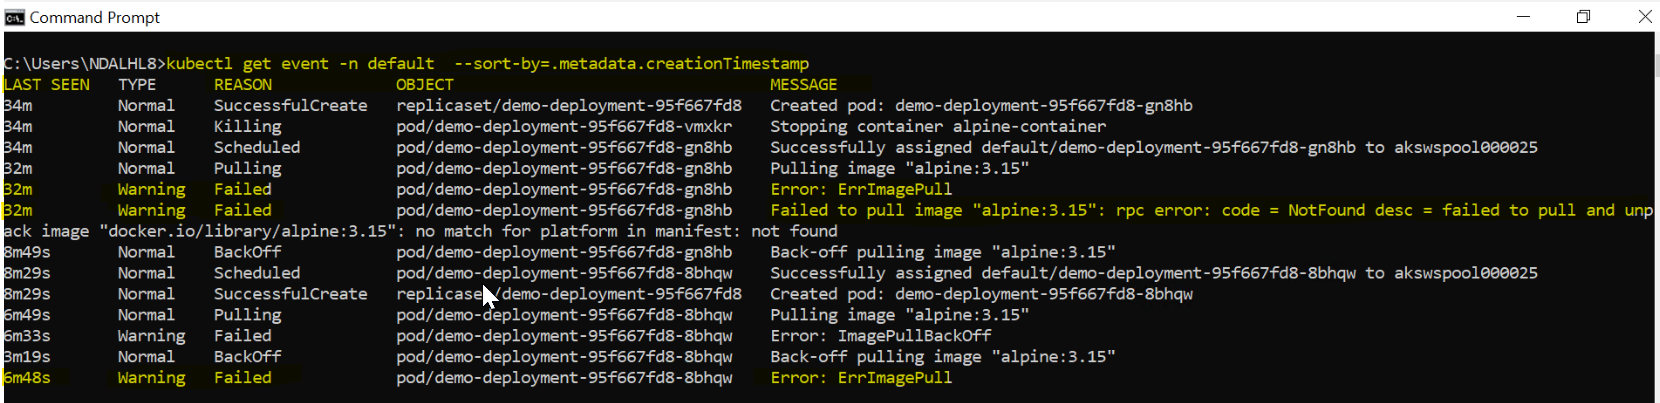
Sort events by timestamp
1 2 3 | kubectl get event -n default --sort-by=.metadata.creationTimestamp |
Add the –sort-by flag to sort events chronologically. This is useful for tracking the sequence of events and understanding their progression over time.
Use JSON or YAML output for complex queries
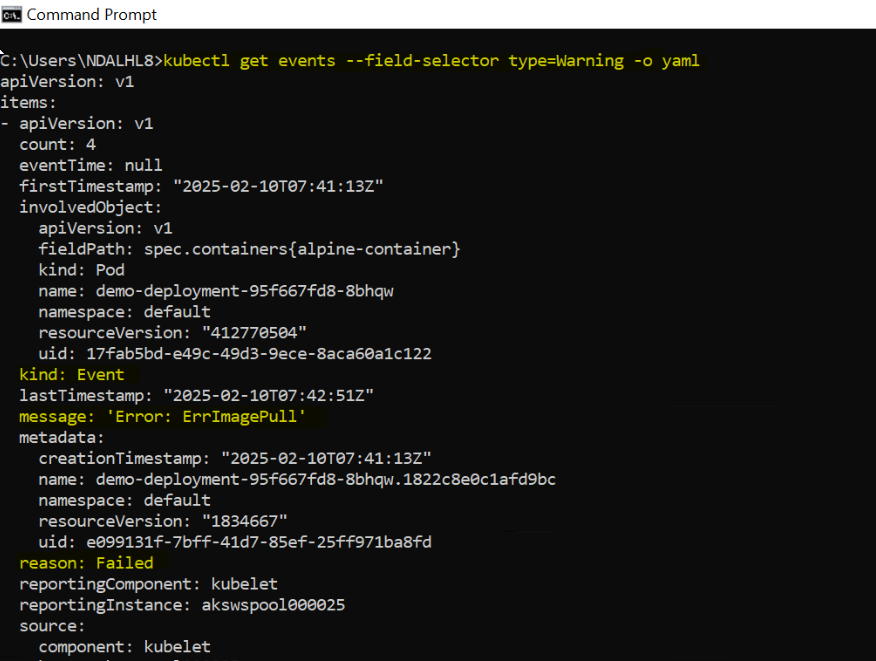
For complex filtering that can’t be achieved with kubectl flags, you can output the events in a structured format like JSON or YAML by adding the -o json and -o yaml flags, respectively. You can then use tools like jq (for JSON) to perform advanced queries and analyses.
1 2 3 4 5 6 7 | kubectl get events -o yaml kubectl get events -o json kubectl get events --field-selector type=Warning -o yaml |
Summary: How to Collect Kubernetes Events Logs
Kubernetes events are short-lived records (retained for 1 hour) that track state changes in cluster resources like pods, nodes, or deployments. They provide critical insights for monitoring, debugging, and alerting but require proactive collection due to their transient nature. This guide outlines their utility, types, and methods to collect them effectively.
Key Concepts:
Why Events Matter:
- Detect issues (e.g., failed deployments, resource limits).
- Track scheduling failures, crashes, or configuration changes.
- Support diagnostics and performance monitoring.
Event Types:
- Normal: Routine operations (e.g., pod scheduling, image pulled).
- Warning: Critical issues (e.g., pod eviction, image pull errors).
Collection Methods Using kubectl:
You can filter logs using multiple ways like View All Events, Namespace-Specific Filtering, Detailed Output, Live Streaming, Precise Filtering, Chronological Sorting, Structured Outputs (JSON/YAML):
Leave A Comment